| Symbol | Name | Open | High | Low | Close | Change | Volume | Date |
|---|---|---|---|---|---|---|---|---|
| ZCZ26 | Corn | 461.00 | 473.50 | 458.25 | 472.50 | ▲ +11.50 | 196,853 | 2026-08-03 |
| ZSX26 | Soybean | 1,182.25 | 1,194.50 | 1,175.25 | 1,192.25 | ▲ +10.00 | 118,692 | 2026-08-03 |
| ZWU26 | Wheat | 635.00 | 653.75 | 632.00 | 651.00 | ▲ +16.00 | 70,508 | 2026-08-03 |
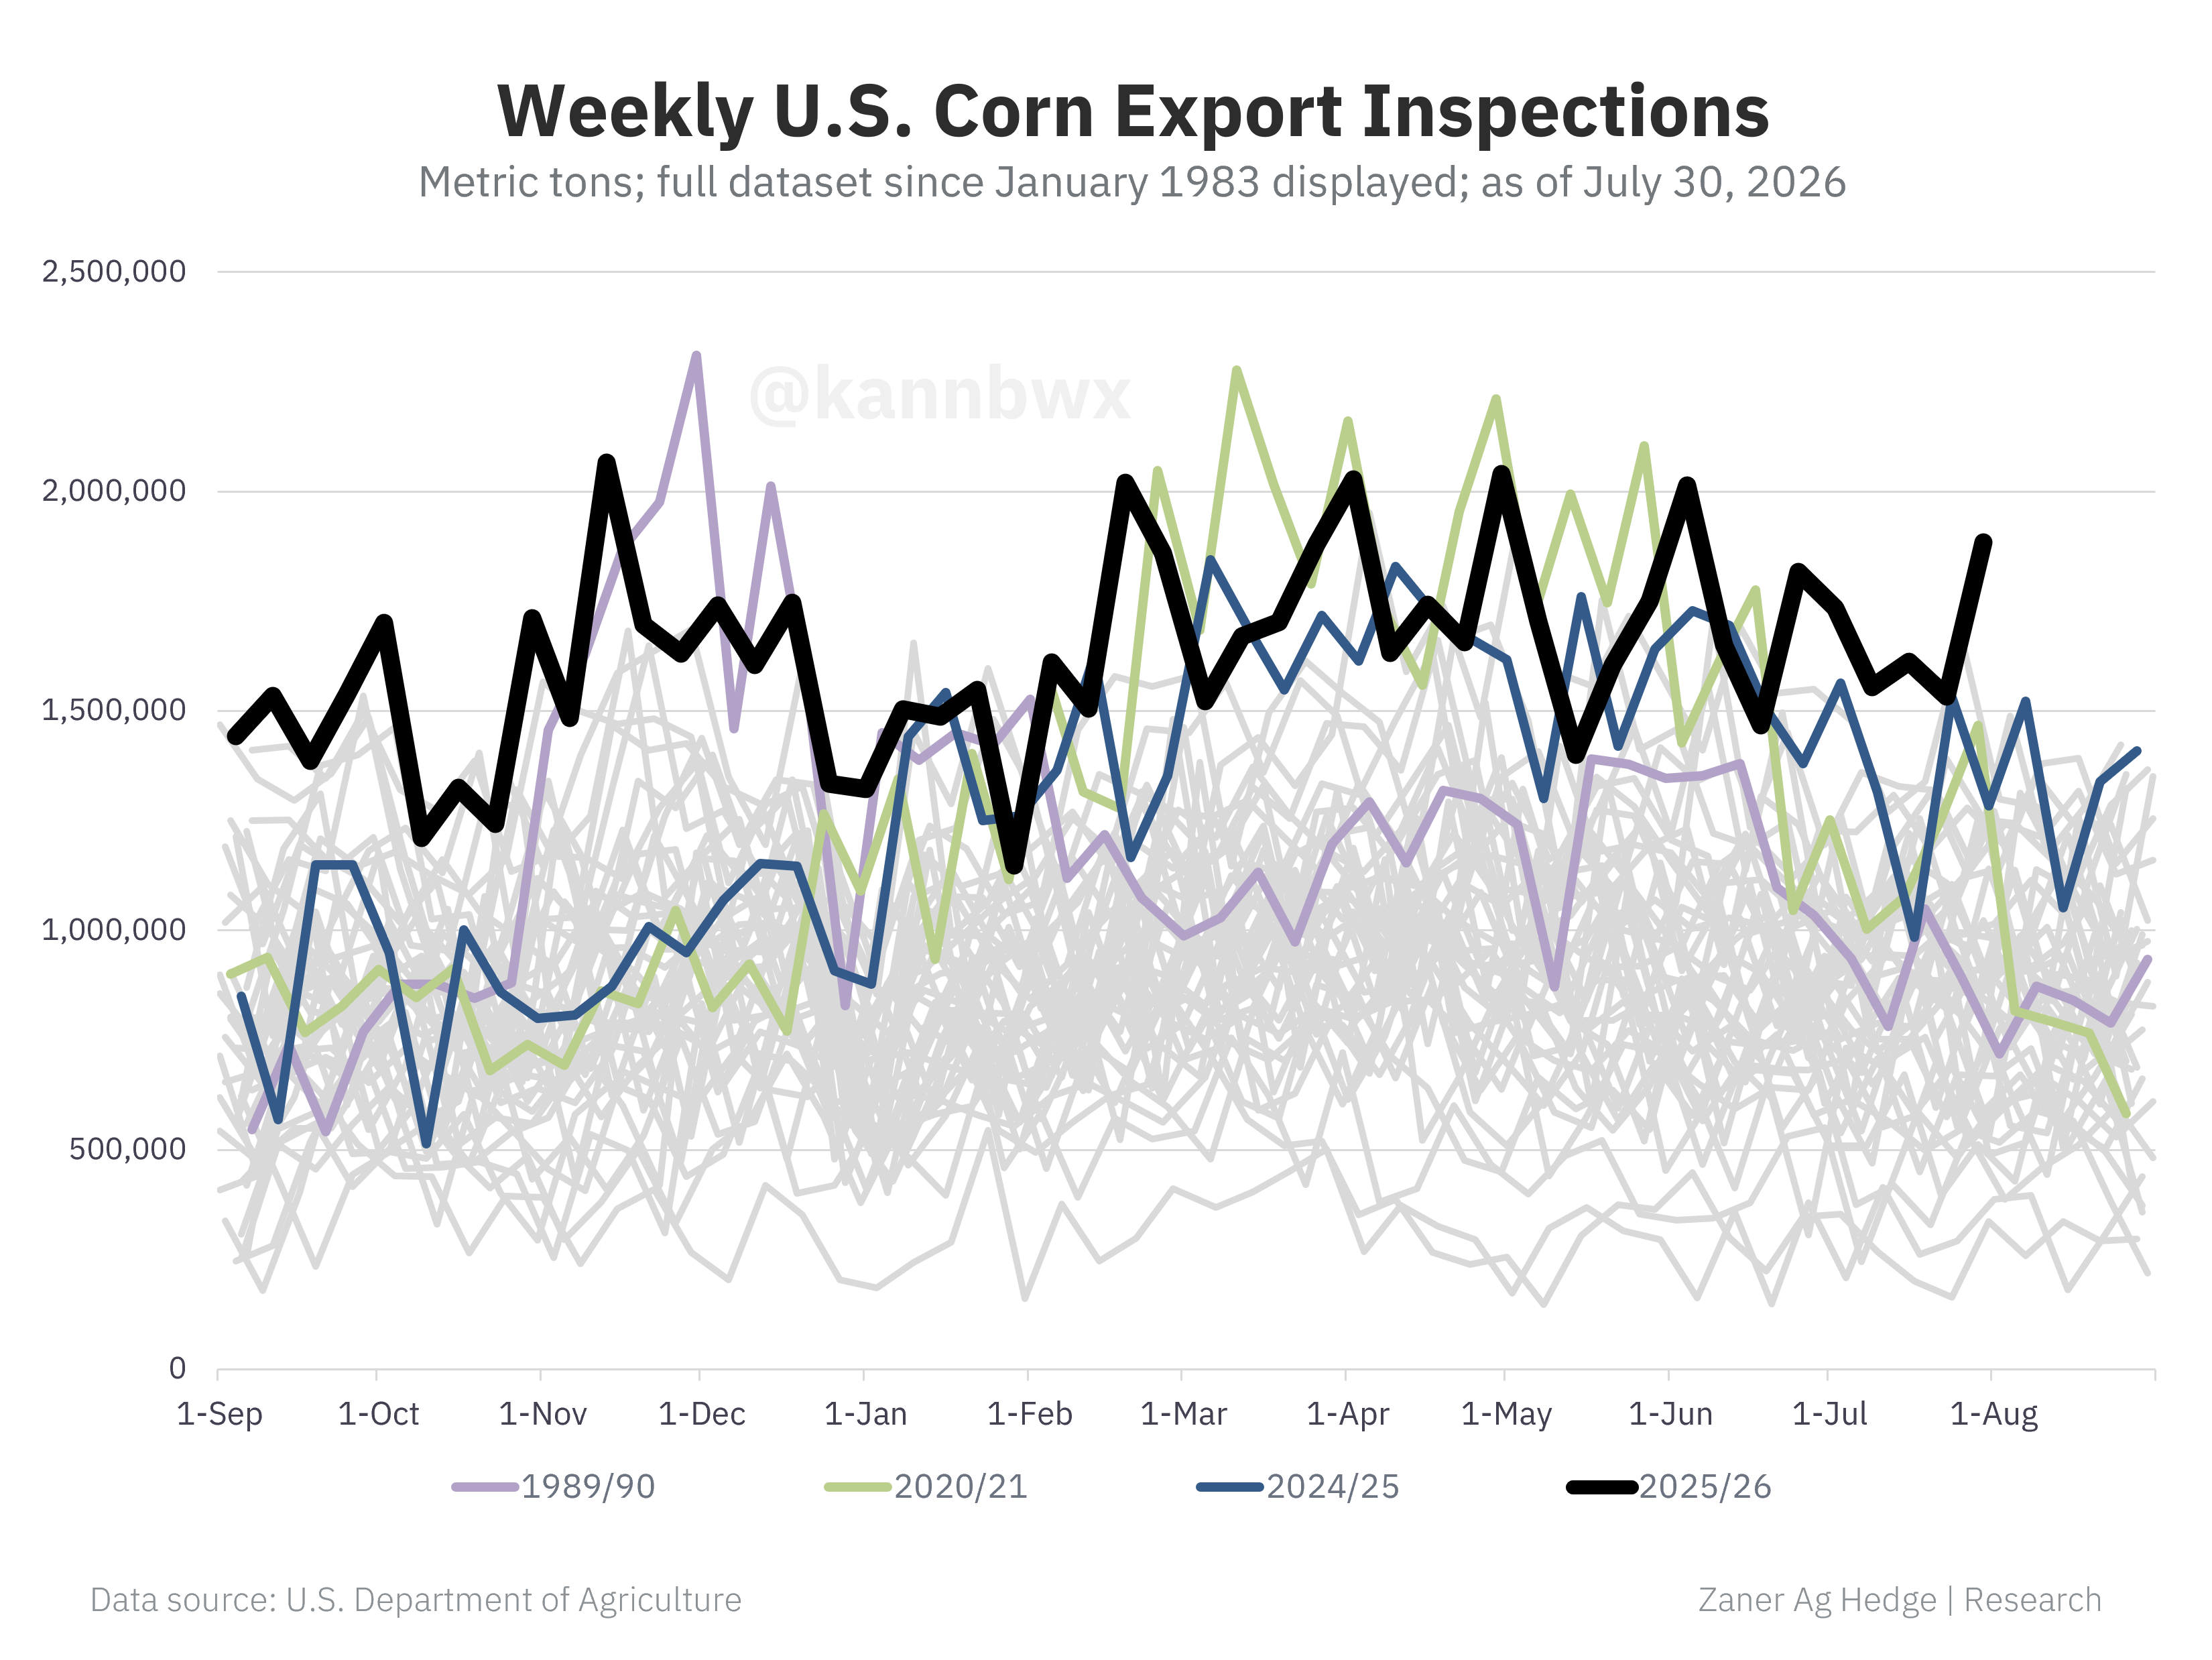
U.S. corn exports are still thriving late into 2025/26. Export inspections in the week ended July 30 totaled nearly 1.9 million metric tons (74 million bushels). That was the largest weekly volume since early June and by far the largest for late July in 40+ years of data. Year-to-date inspections are up 25% year-on-year.
Karen Braun
Here in Southeast IL, we received .9"-1.6" of rain over the weekend, which was a nice surprise considering we were only supposed to get around 0.5". This will go a long way to finish our corn crop strong, with cooler temps incoming as the early corn is denting. Corn and beans both look pretty good for the most part, but we'll need more rain in August for the beans to prosper. We've been working on the combine in the shop and getting our machinery ready, since we may be shelling corn in the early part of September. Mowing and spraying field edges seems to never stop.
Sherman Newlin
Corn futures kick off August with a bang
Strongly higher corn futures were not expected Monday following a soaking Corn Belt rain over the weekend, but that's what they delivered. Boosted by a positive Weekly Export Inspections report, corn futures posted an outside day higher on the December futures chart. Monday's Weekly Crop Progress report showed further decline in the corn crop, coming in at 61% good/excellent, down two points from the prior week. Weather overall looks favorable right now for a good grain fill period.
December corn futures posted an outside day higher Monday and finished back north of $4.70, putting prices back into longer term resistance. A breakthrough from this level has already led to $5.00 a couple of times in 2026, while a failure at this point in the growing season could cause bulls to lose interest. Early overnight action was relatively calm following Monday afternoon's crop report. July was a strong month with plenty of volatility for corn futures. Could August follow suit leading into harvest?
Jason Clapp
November Soybeans rebound off the lows as China buying meets improving weather
November Soybeans drew buyers Monday even as forecasts for beneficial rain across the Midwest late this week eased the heat stress underpinning the market. On the bull side, China returned as an active buyer of U.S. cargoes, and Sinograin set its largest imported soybean auction since January to clear storage ahead of new crop U.S. supply. Traders are also weighing Monday afternoon’s fresh Crop Progress against a crop rated 63 percent good-to-excellent a week earlier.
November Soybeans opened weak at 1182.25 and slid to 1175.25 as the improved forecast pressured the board, but turned to close near the session high of 1194.50 at 1192.25, up 4.75. The bounce leaned on the rising 55-day average near 1177.48 but stalled well below the 18-day simple moving average at 1207.67, a level the bulls have not reclaimed in over a week. The Daily RSI firmed to 48.82 from 47.10, still under the midline, with Thursday’s Export Sales and the August 12 WASDE ahead.
Dan Hussey
Black Sea attacks continue, September wheat holds above chart line at 632
Monday, September Chicago wheat traded as high as 653.75, closing at 652.00, up 11.75. Bears feel, in spite of the attacks on shipping in the Black Sea, wheat and other grains that would normally be shipped by Ukraine and Russia still exist. These products must eventually come to market. Bulls look to reports that Russian exports via the Black Sea could be turned completely off, resulting in 30-35 million metric tons exported vs the USDA forecast of 47.5. NASS crop progress showed 86% of winter wheat and 5% of spring wheat harvested. Crop conditions for spring wheat increased by 2% to 55 % good-to-excellent. Export inspections at 335,313 metric tons were 20% below last week, down more than 50% vs last year.
It is likely that fund month-end profit taking played a significant part in last Friday's weakness. Monday saw September wheat test the 100-day moving average, 631.50, and hold. It is estimated funds sold almost 11k contracts on Friday and were short 16k contracts coming into the week.
Joe Nikruto
Outside Day Lower: Funds Still Hold the Cards
Monday's outside reversal and lower close wasn’t very bullish. It seems that the cattle market can make your head spin every once in a while! Technical selling, poor packer margins, and weak cash trade all played into this outside reversal, even though cash trade last week was $2–3 higher and Choice box beef was up $5.36.
August live cattle closed down $0.52 at $226.22, and August feeder cattle down $1.22 to $342.22. Seasonally, we tend to bottom in late July or early August as demand picks up when the kids go back to school. October live cattle really needs to hold $224.77 and $223.32, or we could see another leg lower. Realistically, a lot of it depends on whether the funds want to keep selling aggressively. That’s the big question.
Additionally, Oklahoma City feeder cattle were up $5-$20 at auction.
Charlie White
Crude is up $1.50 overnight. Crude oil finished sharply lower on Monday, down $4.33, but managed to close above $80 a barrel after gapping over $4 lower. Over the weekend, tensions seemed to ease as President Trump claimed the US and Iran were talking and hopes for a peace deal were once again in the air. Trump also said this is their last chance to sign a deal...again. OPEC delegates Sunday approved their final production increase to 188K bpd for September. This may be hard to accomplish if the war doesn't end and the Strait of Hormuz opens up.
Stock indices all settled sharply higher yesterday and are continuing to push higher this morning. The drop in crude prices Monday eased inflation fears and sent bond yields lower, helping stock prices. The July ISM manufacturing index rose by 2.3, the fastest pace of expansion we've seen in 4 years. It's earning season and most companies are performing well: all the Mag 7 stocks rallied sharply on Monday, except for Apple. If the Iran situation ends, the stock market seems primed for a strong run into fall.
Sherman Newlin
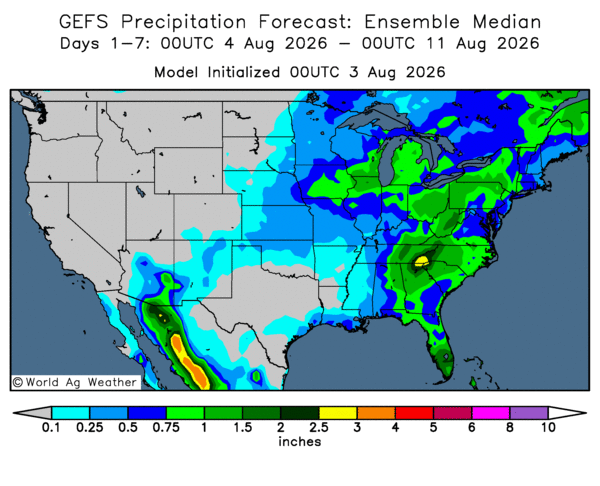
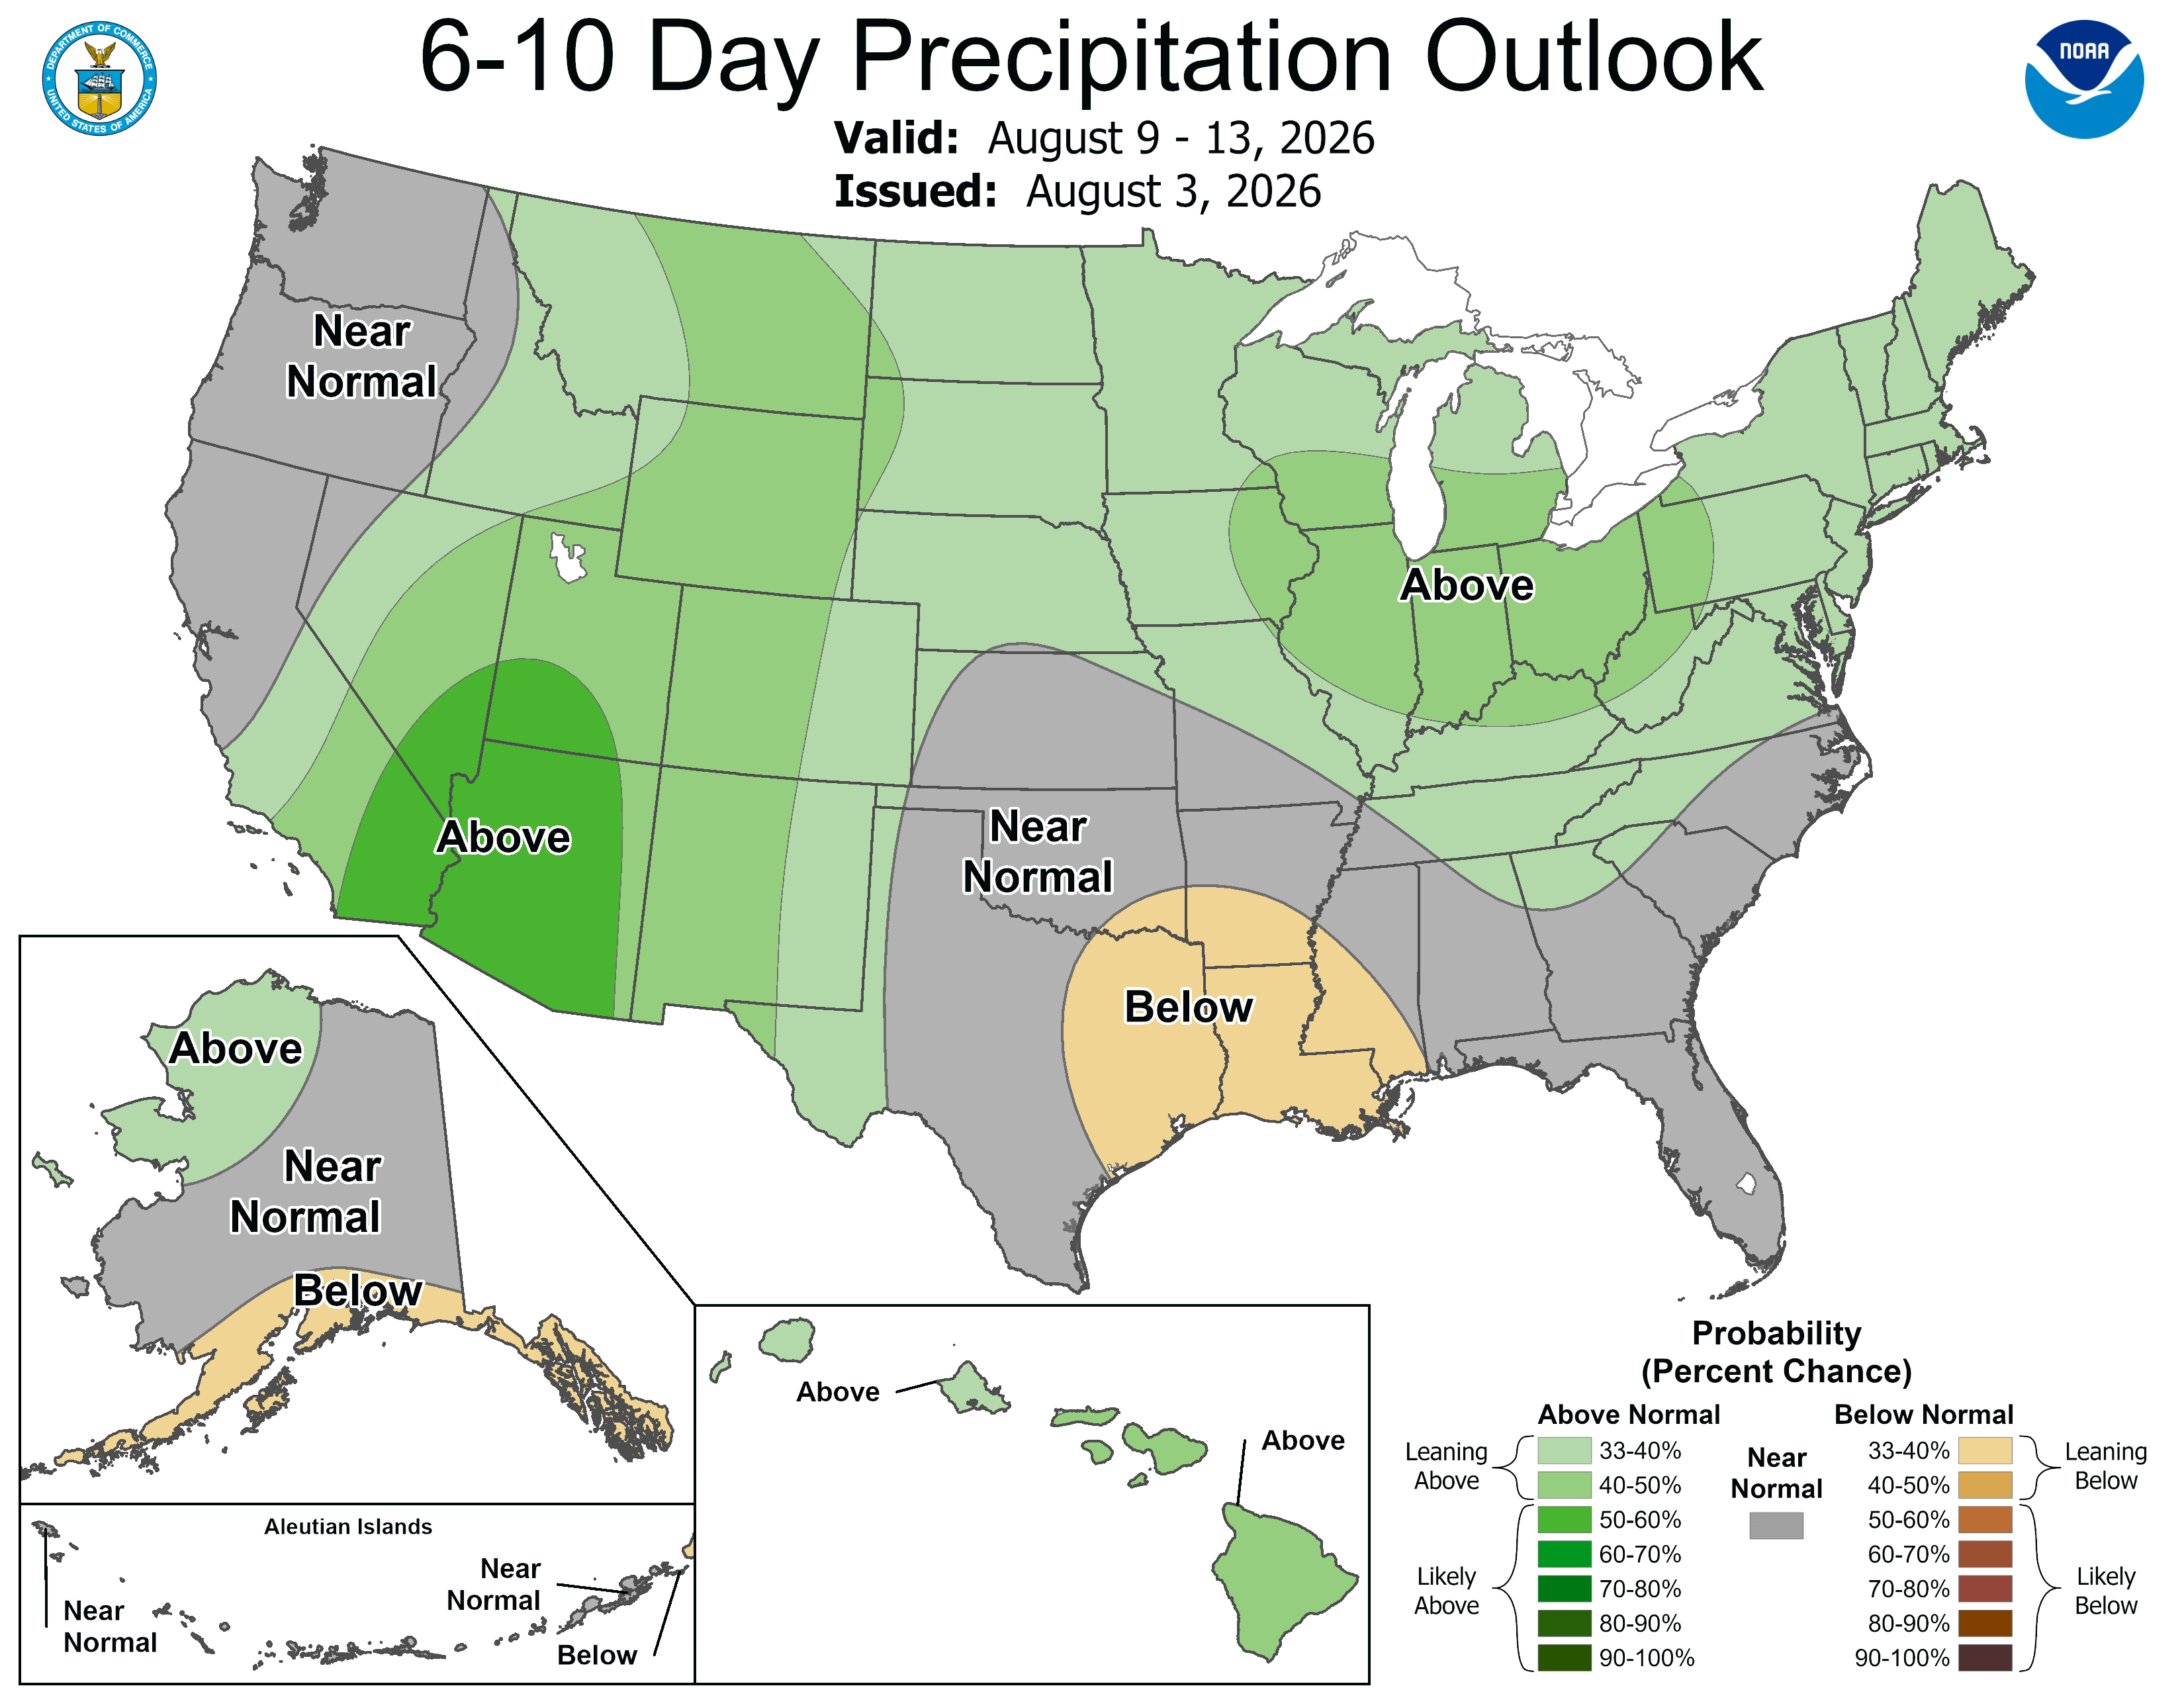
The next several days are forecast to be quite different for the Eastern Ag Belt compared to the Western Ag Belt. Higher chances of rain and normal to slightly-below-normal temperatures are likely to be seen in the East. The West, meanwhile, is expected to revert back to slightly higher than normal temperatures and lower volumes/scattered chances of rain. Longer term forecasts favor this set up moving forward at this point. The NOAA CPC 6-10 day and 8-14 day forecast is starting to push the drier-than-normal area in the Southern Plains further to the south, opening up greater chances of precipitation for the middle portions of the Great Plains by mid August.
Jason Clapp
Karen Braun’s Market Context Newsletter provides data-driven market commentary that helps readers understand the “why & how” in whatever hot topics are driving the markets.
Ted Seifried’s Daily Hotline highlights the day’s market happenings, top news, trends and what to look out for going forward.
Zaner Precious Metals - Stay up to date on the latest market-moving news, actionable insights, product updates & best practices in the precious metals markets.
If you have any questions or would like to hear more about how we can help, reach out to us at info@zaner.com or call 312-277-0050, and we are happy to chat!
Unless otherwise stated, the copyright and other intellectual property rights in all material on this Website (including without limitation photographs and graphical images) are owned by us or our licensors.
You may view or download any part of the Website for private purposes and reference material only. You are not permitted, without our permission, to:
store the Website, or any part of the Website, for any other purpose; print copies of the Website, or any part of the Website, for any other purpose;
reproduce copy or transmit the Website, or any part of the Website, in any way, for any other purpose or in, and/or, to any other medium.
All other rights which are not specifically granted are reserved.
Users are not permitted to use, reproduce, distribute, adapt, amend or exploit these materials for any other purpose or in any other medium or form, including for any revenue-generating purposes.
The information contained at this report have been obtained from sources believed to be reliable, but is not necessarily all-inclusive and is not guaranteed as to the accuracy. This report and all information contained is provided "as is" and without representations or warrantees of any kind, either expressed or implied. Zaner Financial Services LLC does not warrant that use of this report will be timely, accurate, complete, uninterrupted, error-free, or secure; that defects in this report or its contents will be corrected.
Any recommendations can be considered a solicitation for entering into derivatives transactions. From time to time persons affiliated with Zaner, or its associated companies, may have positions in recommended and other derivatives. Any decision to purchase or sell as a result of the opinions expressed in this report will be the full responsibility of the person authorizing such transactions. Any trading, specific investment or investment service contained or referred to in this report may not be suitable for all readers. Futures, options and off-exchange retail foreign currency ("forex") trading is speculative in nature and involves substantial risk of loss. All known news and events have already been factored into the price of the underlying commodities discussed. Past performance is not necessarily indicative of future results. The limited risk characteristic of options refers to long options only; and refers to the amount of the loss, which is defined as premium paid on the option(s) plus commissions and fees.
FOR CUSTOMERS TRADING OPTIONS, THESE FUTURES CHARTS ARE PRESENTED FOR INFORMATIONAL PURPOSES ONLY. THEY ARE INTENDED TO SHOW HOW INVESTING IN OPTIONS CAN DEPEND ON THE UNDERLYING FUTURES PRICES; SPECIFICALLY, WHETHER OR NOT AN OPTION PURCHASER IS BUYING AN IN-THE-MONEY, AT-THE-MONEY, OR OUT-OF-THE-MONEY OPTION. FURTHERMORE, THE PURCHASER WILL BE ABLE TO DETERMINE WHETHER OR NOT TO EXERCISE HIS RIGHT ON AN OPTION DEPENDING ON HOW THE OPTION`S STRIKE PRICE COMPARES TO THE UNDERLYING FUTURE`S PRICE. THE FUTURES CHARTS ARE NOT INTENDED TO IMPLY THAT OPTION PRICES MOVE IN TANDEM WITH FUTURES PRICES. IN FACT, OPTION PRICES MAY ONLY MOVE A FRACTION OF THE PRICE MOVE IN THE UNDERLYING FUTURES. IN SOME CASES, THE OPTION MAY NOT MOVE AT ALL OR EVEN MOVE IN THE OPPOSITE DIRECTION.
We use cookies to enhance your browsing experience, serve personalised content, and analyse our traffic. By clicking "Accept", you consent to our use of cookies.